
A/B testing with Google Analytics Experiments
Right now, A/B testing is the method du jour for website conversion optimisation, enabling users to test different marketing and design choices from the comfort of their own keyboard. There are plenty of tools which exist expressly to provide this in-depth variant testing, but did you know that it is also possible to set up a similar experiment in the ubiquitous Google Analytics?
Google Analytics Experiments is a subset of the Analytics platform, found in the Behaviour view. It allows the user to set up multiple variants of a page in order to test which approach customers respond to better, and then to analyse the results via the Analytics dashboard, making the process very intuitive if you are already an Analytics user. GA Experiments fills a valuable niche in the A/B testing ecology despite the existence of products which are more specialised, such as Optimizely and HotJar. These are powerful tools with very impressive feature lists, but they do tend to be bloated beyond what is necessary. If your site is relatively immobile or low-traffic and simply needs the odd bit of variant testing when introducing a new feature, then Google Analytics Experiments would be a great choice for you.
At Pixel Pixel we recently received a request from a client asking if we could build some A/B testing into their site via Google Analytics. They had heard it was possible, but didn’t know quite how easy it would be! Given the potentially massive benefits of a targeted A/B test campaign, we ourselves have recently been doing some successful in-house testing with Experiments, so we were eager to spread the love.
Below, we will take you through how to set up a simple A/B test comparing two different variants of a page, in order to see which approach performs best for user engagement.
Why use Analytics for A/B testing?

Benefits:
- GA is already on a lot of websites. No extra 3rd party code.
- Simple, non-technical setup.
- Intuitive user interface, with immediate visual results.
- Allows integration with GA conversion goals etc.
- Provides scope to make many changes in parallel – a typical A/B test focuses tightly on specific elements.
- Can test multiple variants (up to 10) – strictly this makes GA Experiments A/B/n testing.
Negatives:
- Fairly simplistic in terms of scope.
- Requires the creation of additional pages which could pose issues for non-technical users.
- Utilises a redirect which users may notice.
How to set up a Google Analytics Experiment
This tutorial assumes that you already use Google Analytics on your site and are at least slightly familiar with the platform. If not, please visit https://www.google.com/analytics to get yourself set up with an account and tracking code. GA is anyway an excellent tool for tracking how users interact with your site and for planning your marketing strategies!
Preparation:
First things first. Before setting up your experiment you will need to consider the following:
- Decide what you want to test – perhaps you have a great idea for a new landing page or you’d like to overhaul your navigation menu…
- You will need to create a separate page for each variant i.e. if you want to try out three new menu designs then you will need four pages. One for the original control page, plus three individual variant pages. These can be identical bar your changes but will need unique URLs. This is where you may struggle if you do not have a technical background, and some CMS platforms will cause you grief. Refer this stage to your development team if applicable.
- You can only test one page per Experiment. If for example you want to try out a new portfolio layout as well as a homepage design then you will need to set up a separate experiment for each. This is perfectly possible as you can run up to twelve in parallel.
- It is best to keep the variance small between each page so as to ensure you know exactly what changes are making the difference. If you change ten things then you will not know which of the ten actually helped!
- Be aware that this functionality only works out of the box if you are using a standard Google Analytics implementation. If you are using Google Tag Manager instead then sadly this is unsupported and will require a workaround. There are various blogs out that that discuss methods of doing this, for example…
- An alternative approach (this is what we have done internally) is simply to temporarily apply the standard Google Analytics code to the pages being tested, whilst still using GTM elsewhere on the site. This will allow you to proceed with your experiment without having to hack around in GTM. Be aware however that this strategy has obvious drawbacks and should not be implemented without considering the possible impact.
Once that’s all ready to go then we can get started!
1. Find the Experiments page:
Open up Google Analytics and navigate to the Behaviour view. Within this view should be the Experiments page – this is where we create and manage our tests. We have created an example one here.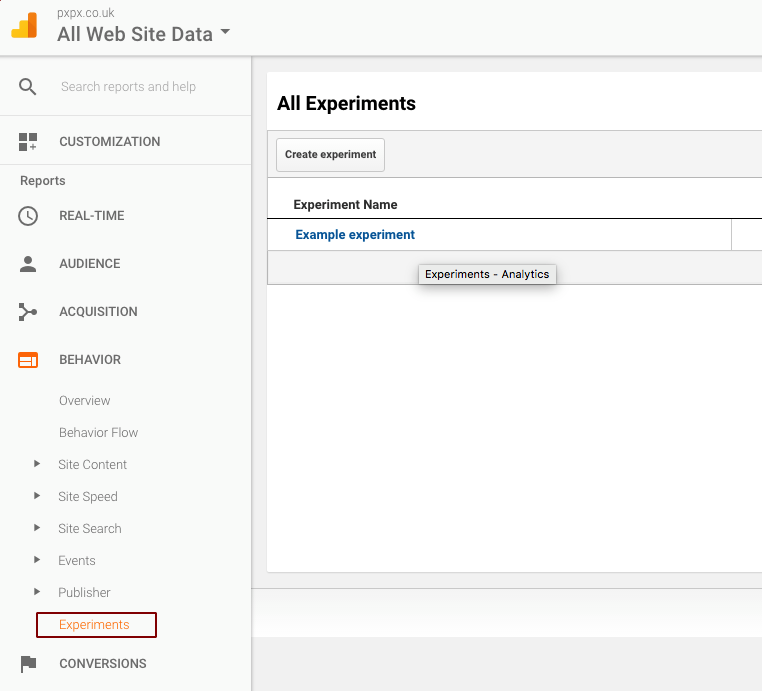
2. Create an Experiment:
To create your new experiment, select ‘Create experiment’ and your view will change to the set-up wizard. Start filling in the fields…
- Name: Self-explanatory…
- Objective: This is the metric that you want to measure. We are going to use one of GA’s default site usage metrics (Bounce Rate) for this example but you can use any of your own marketing goals, and indeed you will here be prompted to create a new goal if you so wish. You can read more about goals here, but an example might be to measure users who reached a certain page on your site, or who stayed for x many minutes etc.
- Percentage of traffic: This allows you to specify what proportion of your visitors should be entered into the experiment pool. This does not mean that the specified percentage will definitely see a variant but that they will be included in the experiment pool, and thus will have a chance of seeing a variant. GA takes the visitor pool and randomly assigns each user to either the default page or one of its variants. If you wish to take a low-intensity approach and avoid exposing a majority of your traffic to a variant user experience then set this value lower, but be aware that you do not have any control over which users will be assigned. For our purposes, we tend to leave this at 100% to get the highest possible experiment traffic and thus lower margins of error.
- VWO offer a nice little tool for measuring the statistical significance of your test via the p-value. When doing any kind of variant testing, you need to ensure that your data density is sufficient to overcome a null hypothesis result.
- Email notifications: Again, you don’t need us to hold your hands 🙂
3. Advanced Options:
It is worth opening up the Advanced Options drop-down as it contains some important configuration…
- Distribute traffic: This is a more complex decision than it might initially appear. Setting this to distribute traffic evenly will ensure that all your variants are receiving numbers of visits roughly at parity, giving you a great comparison baseline. Perhaps 500 people will visit one or the other of two pages, but 200 bounce from one and 300 from the other, clearly suggesting that B offers some advantage.
- The other option is more complex and will “adjust traffic dynamically based on variation performance”. Instead of sharing the incoming visitors equally, Google will start deciding which variant seems to be performing best, and then send more traffic that way. Twice a day, their algorithm will check the performance of each variant and update the fraction of traffic to be sent their way accordingly. The benefit of this approach is that when one variant is clearly pulling ahead, the algorithm can make a reliable final judgment much sooner than if the experiment had been left to run with 50/50 traffic. Google claim that the statistical success rate is about the same as the standard test, at 96.4%, and can feasibly shave weeks off your experiment time, making a big difference to the potential conversion value of your variant.
- This is called the ‘multi-armed bandit’ method and is explained in much more depth over at Google. We are sticking with the simple approach for our small experiment to ensure that our methodology is clear, but if you are testing multiple variants at quite high traffic rates then seriously consider using the bandit method.
- Minimum time: We would recommend always letting the experiment run for at least 2 weeks. Statistical accuracy improves exponentially with the size of the data pool, and it is worth testing over a longer period of time as users will tend to behave differently at weekends etc.
- Confidence threshold: This is the threshold that a variant must perform to before Analytics will declare it the winner. The higher this is set, the longer the experiment could take, particularly if neither variant is dramatically out-performing its sibling.
Phew, that’s the decision making out of the way, on to the next step!
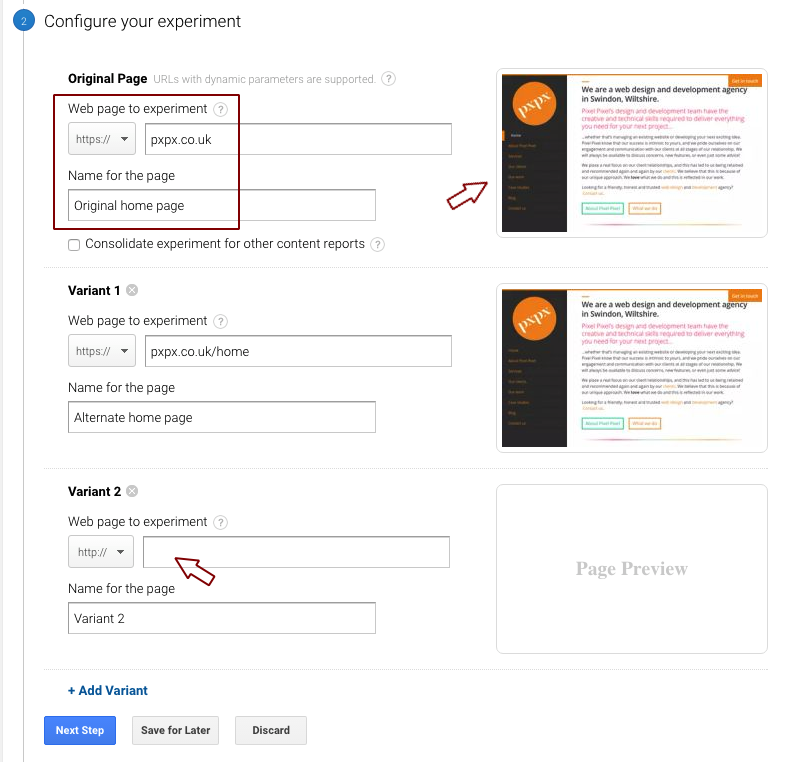
4. Configuring our page variants:
- Specify the original page by entering the URL and giving it a name.
- Do the same for all your variant pages. Make sure you enter the right URLs, but the site should load a preview of each page to help with this.

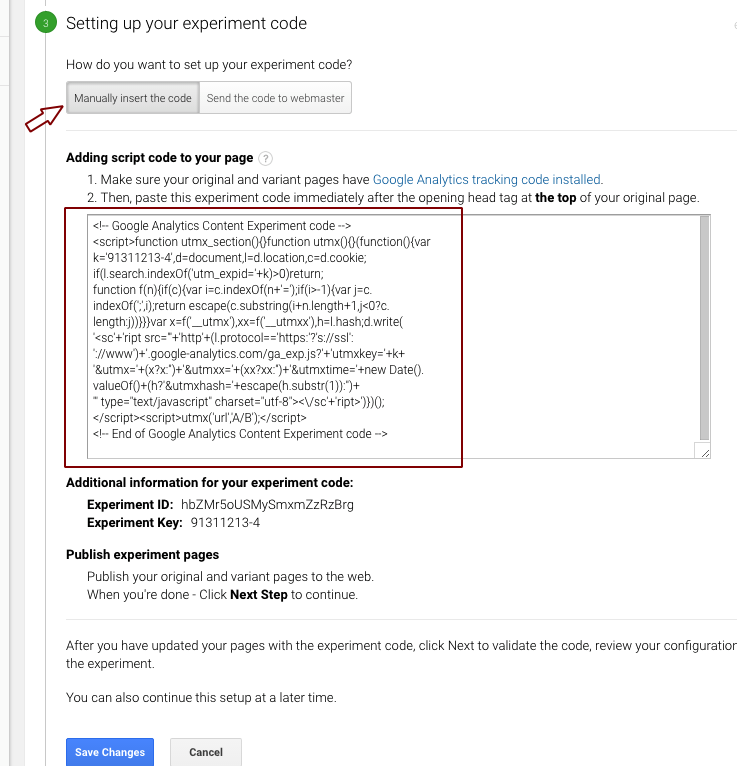
5. Setting up the experiment code:
- We are given two options here – manually insert the experiment code or send it to a webmaster. Seeing as the second option is just sending the information we already have in front of us to some other poor sucker, we will go ahead and ignore this.
- The experiment code looks similar to the standard Google Analytics tracking code and is handled in much the same way.
- Double-check that you have the standard tracking code applied to each variant.
- Now add the new Experiment code immediately after the opening tag of your original page only.
- When ready, save your changes to move on and validate your setup!

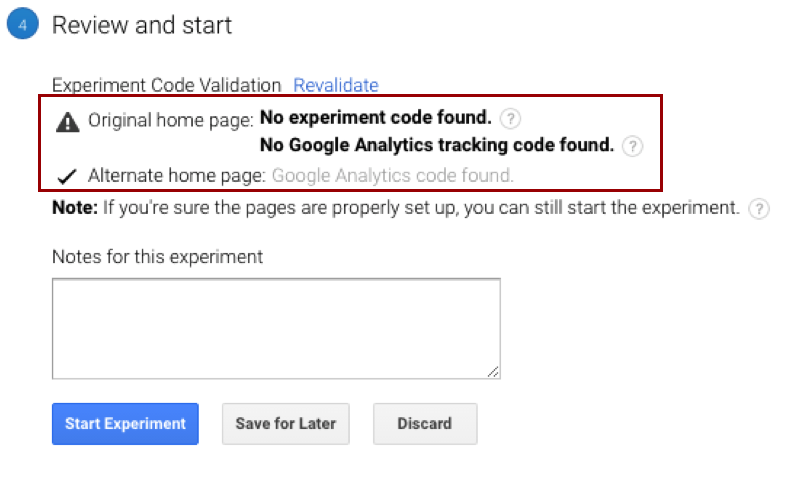
6. Validate and confirm.
- Hopefully, you did everything correctly but if not, Google will tell you now!
- If you have used the wrong code or placed it before the standard Analytics code then Google should throw up an error similar to the ones here. The error messages are pretty self-explanatory and should help you to identify what the issue is. Usually, it will be that you have put the experiment code below the regular Analytics code or have specified the wrong URL at the earlier stage. Be aware that it will throw an error if you are using Google Tag Manager instead of Google Analytics. We mentioned this earlier, but you will need to either use standard Analytics on these specific pages or find a workaround enabling you to do the experiments with GTM.

7. Start your Experiment! 🙂
8. Check your progress
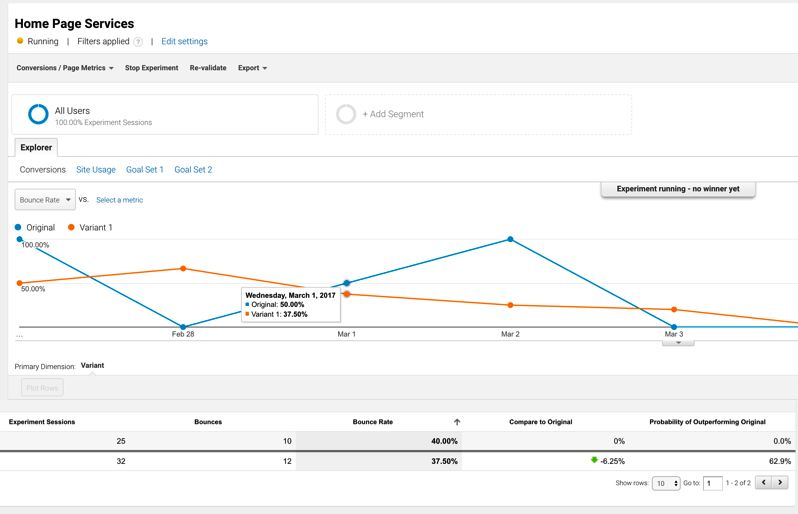
- After a short while, check back to see what progress has been made. Go back into the Experiments page and you should now see a line chart similar to many of the other views within Analytics. We can keep tabs from here on how our experiment is progressing, and which variant looks to be the most successful. You should be able to see the numbers assigned to each variant along with the metric being measured, and importantly, the possibility of it outperforming its rivals.
- The ‘Compare to Original’ and ‘Probability of Outperforming Original’ are key metrics which Analytics calculates. Keep an eye on these as they show the relative success of each variant as measured against the original page and your key metric. In our example, you can see that the day to day results are quite up and down, but we already have a possible winner emerging, with ‘Variant 1’ showing a definite improvement. This is reflected in Google’s estimated 62.9% of success (this will change from day to day, however!).
- At this stage, you can also edit your experiment settings, re-validate your code or stop the experiment. Avoid fiddling with anything at this point as you will jeopardise the value of your data, so keep your hands off!

9. Declare a victor!
Sooner or later, the Experiment will finish and declare a winner. Now it’s time to take what you’ve just learned and to apply your changes in the wild. Hopefully, your conversion rates will now reap the benefits of having backed up your exciting UX changes with some concrete analytics data!

A/B testing is a very useful tool but it does come with some caveats regarding its statistical rigour and proper application. For further reading around the value and application of variant testing, including its disadvantages, check out these great articles:
- A/B Testing and the Benefits of an Experimentation Culture
- Are You a Victim of Your Own A/B Test’s Deception?
- What is A/B Testing?
- Don’t do A/B Testing [Rant]
- Interview with Bigstock re: A/B success.
- A/B test ideas and case studies.
- Content Experiments Without Redirects
We hope that this little tutorial has been useful for you. If you need any further help with planning or setting up your A/B Experiments, or with any other design and development work, please feel free to drop us a line 🙂
By: Chris Snowden