
Intro to web timing APIs
Measuring time in the browser can be a fiddly business with questionable accuracy, particularly when benchmarking. But with the Web Performance interface, that doesn’t have to be the case..
Timing in the browser using the web performance interface.
How would you go about timing a function or measuring page load speeds in the browser? There are generally three standard approaches:
- Date() object – Can become complicated when mixing multiple instances and has questionable accuracy.
- console.time() – Very useful little tool, but lacks built-in functionality and accuracy.
- Use an external library such as MomentJS – Moment is a superb offering, but it will likely be to be overboard to include this in your project if you simply want to time your page load.
Often the better solution would be to use one of the little-known Web Performance APIs. Below, we’ll take you briefly through the two most useful – Navigation Timing and User Timing. Both are available by default in modern browsers and have wide compatibility (see support details further down).
Navigation timing
The navigation timing API exposes timestamp data measuring navigation and load milestones.
Accessible through the window.performance.navigation object, this API registers values for a whole raft of page load milestones. You can check out the full details of the process over at W3, but the navigation model is structured as follows:
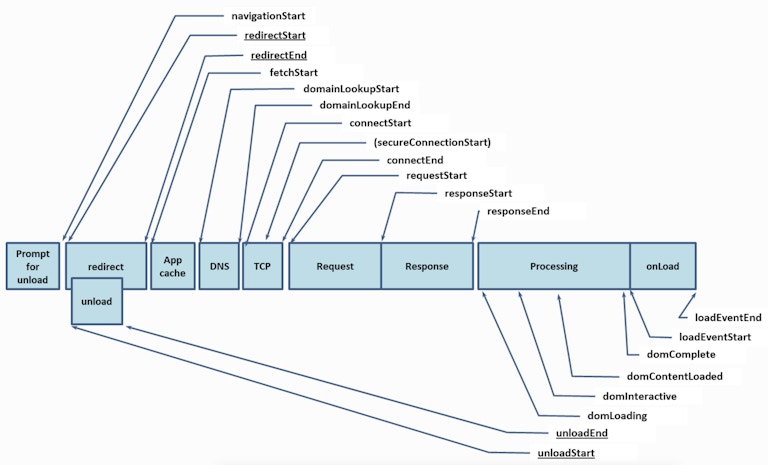
As you can see, this model provides us with quite a nice level of granularity for tracking the various progress indicators of our page load. Values like ‘navigationStart’ and ‘domComplete’ are immediately obvious in their utility, but being able to track timestamps for request and response is also super interesting.
These values are stored automatically for your session so you can happily access them after the load has happened – i.e. you don’t need to run the code before or simultaneously with the action you are trying to measure. This also means that this data is publicly accessible via the browser console.
Usage:
Simply view the window.performance object (read-only).
Example usages:
- Testing the time the page took to load to DOM availability from initial navigation with e.g.
var time = window.performance.timing.domInteractive - window.performance.timing.navigationStart; - Measuring your DOM-specific load needs by comparing the values of
domLoading&domComplete. - Compare your own performance with that of a peer by checking their load speeds in your dev tools.
- View all values compared to the initial
navigationStart.
To print out all available data from the object, you can use a function similar to the below…
var timingData = window.performance.timing,
initialise = window.performance.timing.navigationStart;

$.each( timingData, function( a, b ) {
    if ( a != 'toJSON' ) {
        if ( b > 0 ) {
            c = b - initialise;
        }
        else {
            c = null;
       }
    console.log(a + b + (c != null ? ' / ' + c + 'ms' : '') )
    }
});
Formatted a little, your output might look like this: 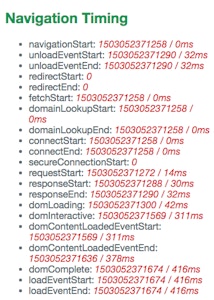
User timing
The user timing API exposes methods allowing the user to time specific events using performance marks.
Accessible through the window.performance object, this API allows the user to add ‘marks’ to a piece of code. Each mark stores a high-res timestamp (accurate to 5 milliseconds). The time elapsed between multiple marks can then be saved as a ‘measure’. This is super handy for tracking how long a function or script is taking to run!
While similar to console.time(), performance marks allow you to create a raft of grouped performance measures and is much easier to build a suite of tests with. Not to mention the accuracy is much improved.
For quick and basic timestamps, performance.now() is also available (measures time since performance.timing.navigationStart).
Usage:
- Timing how long a js file takes to run.
- Checking the processing-time impact of a recursive function or callback;
- Measuring the time it takes a user to make two actions.
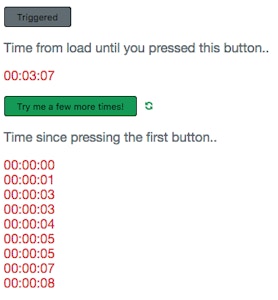
Simple timestamp:
$('#button1').click(function() {
    console.log( performance.now() );
});
Measure intervals:
$('#button1').click(function() {
    performance.mark('button-1-click');
});
$('#button2').click(function() {
    performance.mark('button-2-click');
    performance.measure('click-interval','button-1-click','button-2-click');
});
   console.log( performance.getEntriesByName('click-interval')[0].duration );
   performance.clearMeasures('click-interval');
Annoyingly, the values stored are unix-style timestamps which is not the most user-friendly format to read. Fortunately, we can fix that with a little helper function to print out in a nicer format…
function timeFormat(x) {
    var date = new Date(null);
    date.setSeconds(x / 1000);
    return date.toISOString().substr(11, 8);
Support
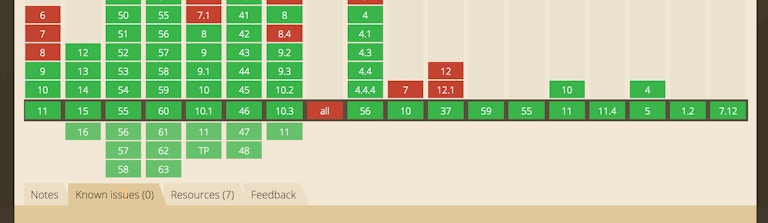
Support is solid for both with the unfortunate exception of IE9 for the User Timing API. Navigation Timing, in particular, is solidly safe for use in production.
Next steps..
The window.performance object also provides other functionality so it is worth investigating beyond our quick examples.
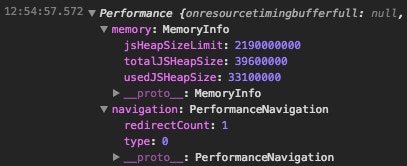
For instance, you can track the number of redirections the user agent has followed via the navigation object’s redirectCount property. As shown in the screenshot, Chrome also adds a memory property!
Further Reading
- https://developer.mozilla.org/en-US/docs/Web/API/User_Timing_API
- https://developer.mozilla.org/en/docs/Web/API/Navigation_timing_API
- https://www.w3.org/TR/navigation-timing/#processing-model
- https://www.html5rocks.com/en/tutorials/webperformance/basics/
- https://johnresig.com/blog/accuracy-of-javascript-time/
- https://gist.github.com/paulirish/2fad3834e2617fb199bc12e17058dde4
- https://developers.google.com/web/updates/2012/08/When-milliseconds-are-not-enough-performance-now
- https://developer.mozilla.org/en-US/docs/Web/API/DOMHighResTimeStamp
Pixel Pixel are passionate about web development and design. Let us know if you enjoyed the article or have any questions!
By: Chris Snowden